Wellesley Public Schools students’ English MCAS scores remain lower post-pandemic; math & science mostly positive
State-wide MCAS scores show that Wellesley elementary and middle school students still have not recovered to pre-pandemic levels in English and writing skills, while math and science scores are at the same or better than results before 2020.
Another area of concern was the performance at Upham and Schofield elementary schools, which are far below Wellesley’s other elementary schools.
In addition, wide disparities in MCAS performance persist among student groups by race/ethnicity and students identified as high-needs, meaning those with disabilities, low income, or English-language learners.
“In many cases, you’ll see students responding favorably to their learning and in other cases some student groups persisting with disparities in their learning,” Wellesley Public Schools Assistant Superintendent Sandy Trach told the School Committee during the Oct. 8 meeting (watch on Wellesley Media beginning at 32:32).
“There is much to acknowledge in the district, meeting and exceeding its accountability target. In the same vein we remain steadfast in closing the gap for students who have been historically underserved, it is only then that we will have fulfilled our promise of all means all,” Trach said.
MCAS English Results Still Lower than Before 2020
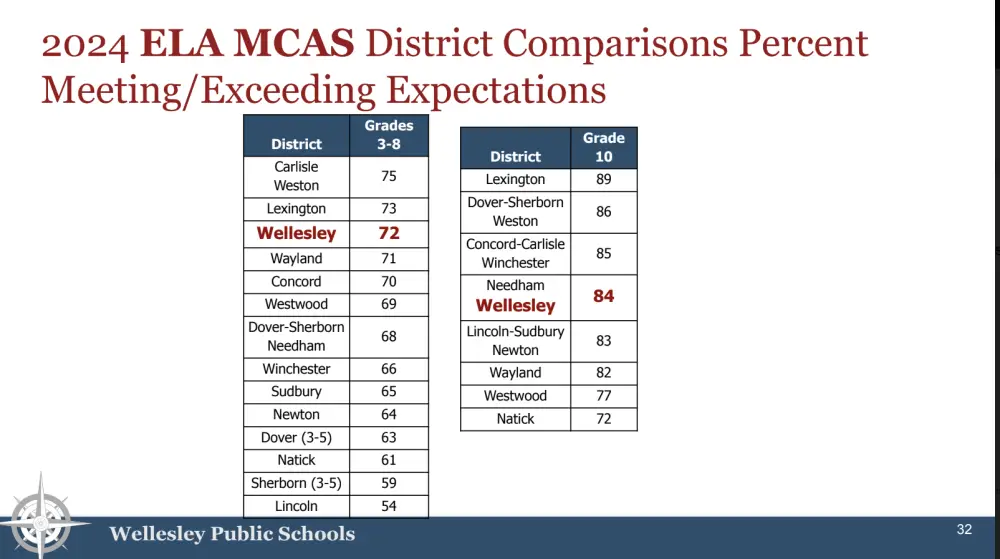
Students in grades 3 to 8 have not yet recovered to pre-pandemic levels in English, MCAS scores show. For grades 3-5, 71 percent met or exceeded expectations, compared with 83 percent in 2019. In middle school, 73 percent met or exceeded expectations, compared with 77 percent in 2019.
In contrast, 10th grade students have rebounded, with 84 percent of students met or exceeded expectations in English, compared with 85 percent in 2019.
Wellesley’s peer districts and across the state similarly seem to be struggling with English skills in grades 3 to 8. Only Carlisle, Weston and Lexington elementary schools topped Wellesley for grades 3 to 8. Among peer high schools, Wellesley was topped by Lexington, Dover-Sherborn, Weston, Concord-Carlisle and Winchester, and tied with Needham.
Math, Science Results Better
Scores in math and science show that Wellesley students are at or above pre-2020 levels. In math, 77 percent of students grade 3-5 met or exceeded expectations, compared with 76 percent in 2019. And in science, 78 percent of 5th grade students met or exceeded expectations, compared with 67 percent in 2019.
For grades 6-8, 74 percent of students met or exceeded expectations in math, compared with 73 percent in 2019. And in science, 78 percent of 8th grade students met or exceeded expectations compared with 79 percent in 2019.
The high school math score is troubling because scores have varied widely over the past five years. In 2024, 81 percent of students met or exceeded expectations in math, compared with 89 percent in 2023, 83 percent in 2022, and 88 percent in 2019.
YES, sign me up for Swellesley’s weekday email newsletter
In science, 81 percent of high school students met or exceeded expectations, compared with 72 percent in 2022. This version of the science, technology and engineering test was first given to 10th graders in 2022, so there is no pre-pandemic comparison score.
Among peer districts in grades 3 to 8, Wellesley tied for third in math and science, while among high schools, Wellesley tied for 5th in both math and science.


Upham, Schofield Lowest Performing in WPS
Upham and Schofield elementary schools remained Wellesley’s lowest performing schools. Upham scored 82 percent, which is described by the Massachusetts Department of Elementary and Secondary Education (DESE) as showing substantial progress towards targets. Bates Elementary School earned the highest marks for school accountability, with a 99 percent score and named a school of distinction by DESE.

The grades for elementary schools are based on accountability, which means how students performed on MCAS compared to peers around the state as well as how much students improved compared to how similar students have performed in past years.
The performance of Upham and Schofield was particularly concerning to School Committee members because it was “nearly 20 points lower” than Bates, which scored 99 percent on accountability.
Schofield Principal Jordan Hoffman said her school is taking the MCAS results seriously.
“First and foremost, we are ensuring that all students have equitable access to strong Tier I, or core instruction, using the guaranteed and viable curriculums we have for literacy and math,” Hoffman said. “Grade-level teams are collaborating with math and literacy specialists to design instruction that meets the needs of all students.”
Trach emphasized during the meeting, and in an email with the Swellesley Report after, that each school’s accountability scores are based on unique elements to that school and compared uniquely with schools that have similar makeup of students around the state.
“Accountability targets are established uniquely and annually for each school by DESE and are composed of multiple separate elements. Specifically, each school’s accountability consists of criterion points assigned by DESE for each element. Based on these annual factors, each school’s accountability is going to be different,” Trach said via email.
Related: What Wellesley voters need to know about state ballot Question 2 on MCAS exams
Disparity Among Racial Groups, High-Needs Learners
Wide disparities in MCAS performance persist among students groups by race/ethnicity and students identified as high-needs, meaning those with disabilities, low income, or English-language learners.
The percentage of Black and Hispanic students meeting or exceeding expectations was lower than the Wellesley average in every test for grades 3 to 8, and almost every test for 10th graders. High-needs learners, which includes low-income, disabled and English language learners, also had fewer students who met or exceeded expectations than the district average at every grade and every test.
For example, less than 50 percent of Black students and just over 50 percent of Hispanic students met or exceeded expectations on the math MCAS in grades 3 to 8. In comparison, more than 75 percent of Asian and white students met or exceeded expectations in math.

Wellesley is not alone. Disparities among demographics exist across the state.
“Some of the traditional measures and means of what we’ve done for students and student groups are not necessarily closing the gap nor are they accelerating instructions, and so that is an area we must change. We are actively working on that,” Trach said.
How Wellesley is Responding to MCAS
School Committee members expressed concerns about the district’s MCAS results, focusing especially on the disparity among student groups by race, and the disparity between Bates and Schofield.
Trach explained that Wellesley first reviews the MCAS results from a data level to identify performance trends. The district’s data teams have been meeting regularly since receiving MCAS results to see where district-level changes can be made.
Next, Wellesley school officials examine the results “student by student,” according to Kathleen Bernklow, WPS director of student services. For example, at Schofield, Hoffman, the principal said: “We are providing tiered intervention for students who are below grade level in reading and math, and setting up consistent systems to monitor student progress and their response to the interventions.”
School Committee member Christina Horner, a former teacher, asked about how Wellesley schools use in-school testing to measure performance of students and whether it shows the same performance disparities that MCAS revealed. Trach confirmed that is done, but said she didn’t have results from the in-school testing to share with the committee at that time.
Trach also signaled that the district may be rethinking its approach especially to try to improve learning disparity among student groups.
“Sometimes it’s not about doing more, it’s about doing differently. That’s part of the shaping and shifting we need to do in professional learning. How are we changing what we’re doing, say with culturally and linguistically sustaining practices in the classroom.”
“It’s going to take a whole district effort around supporting those students,” she said.
Absenteeism Remains A Problem
On Wellesley’s overall scorecard from the state, Wellesley earned just 2 of 4 points for its handling of chronic absenteeism, and 0 out of 4 points for chronic absenteeism among its lowest performing students.
Overall, about 35 percent of high school students miss 10 days or more of school, and 14 percent miss 18 days or more. This was a slight decline from 2023, when about 15 percent of students missed 18 days or more.
Absenteeism was especially noteworthy among diverse students. In 2024, 30 percent of Black students, 26 percent of Hispanic students, 8.5 percent of Asian students, and 13.1 percent of white students missed 18 days or more, which the state designates as chronically absent.
Chronic absenteeism also was higher among high needs learners, which is an unduplicated count of students with disabilities, English-language learners, or identified by the state as low income. In 2024, 49 percent of high-needs learners missed at least 10 days of school, and 34 percent missed 18 days or more.
“We know that consistent attendance is linked to strong academic achievement,” Trach said. Beyond the academic impact, Trach noted that missing school may indicate problems with “students’ feelings of connectedness and belongingness, which are crucial to equity and excellence.”
“Feeling belonged and connected in school is important to a student’s success.” Trach said.
Other Takeaways from MCAS Scorecard
- WPS enrollment by race/ethnicity for 2023-24 academic year: 4 percent African American (compared with 9.6 percent in Mass.), 17.8 percent Asian (7.4 percent in Mass.), 7.3 percent Hispanic (25.1 percent in Mass.), 63.3 percent white (53 percent in Mass.), 7.6 percent multi-race, non-Hispanic (4.5 percent in Mass.).
- 92% of 11th and 12th graders at WHS completed advanced coursework, which includes AP, International Baccalaureate, dual enrollment classes and other selected rigorous courses.
How MCAS is scored
The MCAS scores range from 440 to 560, with a score of 500 needed to meet expectations. Students scoring below 469 are considered not meeting expectations, students scoring 470-499 are partially meeting expectations, and students scoring 530 and above are exceeding expectations.
How to Dig Deep in MCAS
Can’t get enough of school data? The Wellesley School District provided only an overview slide show during its presentation to the School Committee, and some of the key findings related to math and diverse subgroups were not discussed in detail. For this article, I also reviewed the Boston Globe’s excellent data analysis, and also the Department of Elementary and Secondary Education site.
By contributing reporter Jennifer Bonniwell